ENV: Zabbix 5.2.6 (edit: now 5.4.4 with recent release) Server on rhel8 eq, Zabbix Proxy 5.2.6 on rhel7 eq, Zabbix Agent 5.2.6 on same host as proxy. Sungrow SG8K-D (AU) Solar Inverter. With a heavily modified solariot script for querying data from the inverter.
In a new line of writeups I’ll be covering a recent project completed on a good mates brand spanking new solar system.
He sorted alittle over 9kW of panels across two strings on his home; with a Sungrow 8kW (SG8k-D) solar inverter. The inverter measures its own output, and uses a DIN Rail mounted (Sungrow S100) module with Split-core CT (Current Transformer) for current sensing on the houses Single Phase (1P) Service Line. The primary goal for the inverter here is to ensure it does not exceed the local utility company export limit of 5kW per phase; the nice secondary to that is the inverter also calculates a sum of the instantaneous house power loads, and even energy imports and exports over time, even at night when the inverter is sleeping.
As I have long described; any data that you can get to display in a Linux terminal, you can store and display in Zabbix.
Section 1 – Data Collection
The inverter includes a wifi connector module that associates with the home network and reports data to the manufactures cloud service. This is display in the app. But has a couple of downsides. Mainly a 5 minute data resolution and 5 minute lag in data being displayed on top of that.
The inverter does have an option for instant data display in the same app; however you need to be connected to the inverters own access point (AP). So using a USB wireless adaptor connected to pfsense and a NAT rule any device on the main network can query the inverter at 11.11.11.1 (its default ip) and interrogate it for data.
Sungrow uses modbus over tcp for communicating with the mobile app in instant data mode so our collector agent should do the same. Lucky rpvelloso over on github already has a python module for talking the special flavor of modbus that sungrow utilizes (See Sungrow-Modbus) and meltaxa also on github (and Brisbane Qld based) wrote and maintains solariot for collecting data from inverters. This package however does not have a current option for one-shot with the output printed to the terminal in json.
Modified solariot.py bellow
This script was updated to a newer edit that is less aggressive in its scans on 2021-09-10
Which has an accompanying config.py file
and modbus-sungrow-sg8k-d.py inverter config / modbus id lookup file, which is based on the modbus-sungrow-sg5kd.py file within the solariot github; just with a few other discovered additions.
Those have been placed in the /srv directory of our zabbix-agent linux container and a one-liner bash script was written to one-shot call and print the json output to terminal.
#/srv/query.sh
cd /srv/ && ./solariot.py --one-shot -c config --print
When calling the query.sh script it either errors, which the inverter seems to just not respond on around one in every 10 queries, or dumps something similar to this to terminal.
{"inverter_size": 8.0, "daily_power_yield": 30700.0, "total_power_yield": 8.58, "inverter_power_on_hours": 614, "internal_temp": 56.8, "pv1_voltage": 356.6, "pv1_current": 7.8, "pv2_voltage": 262.4, "pv2_current": 3.7, "total_pv_power": 3774, "grid_voltage": 245.4, "inverter_current": 14.8, "total_active_power": 3642, "grid_frequency": 50.0,"house_loads": 1553, "daily_export_energy": 25500.0, "total_export_energy": 667.7, "daily_import_energy": 4800.0, "total_import_energy": 262.9, "daily_self_consumption_energy": 5200.0, "total_self_consumption_energy": 190.9, "year": 2021, "month": 5, "day": 13, "hour": 14, "minute": 15, "second": 29, "timestamp": "13/5/2021 14:15:29", "export_to_grid": 2089, "import_from_grid": -2089, "export_import": -2089, "pv1_active_power": 2781.48, "pv2_active_power": 970.88, "total_pv_active_power": 3752.36, "pv_power_losses": 2.9410824121352994}Assuming you have some knowledge of zabbix agents you add a file to /etc/zabbix/zabbix_agentd.d/ named sungrowqueries.conf with the following config and zabbix can now query that agent for the sungrow data receiving a json dump response.
#! /etc/zabbix/zabbix_agentd.d/sungrowqueries.conf
UserParameter=sungrow.ql.json,/srv/query.sh
Add a “Zabbix Agent” type item to your host or template. Name it (I went with “Query Live Power Flow BatchRequest”). Set the key to match the userparameter config, so “sungrow.ql.json”. Set type to text. Set update interval to your desired data resolution. We went with 30seconds or just 30 in the input field and add your item. Confirm under Latest Data the item is receive data from the agent. Each value will be one complete json dump.
Section 2 – json into the Zabbix Server
With the json dumps now being queried and collected in zabbix we can breakout the individual data points.
Well start with a good one; total_active_power, or the solar power in AC being generated by the inverter.
Along side your “Query Live Power Flow BatchRequest” item, add a new item.
Name: Inverter total_active_power
Type: Dependent item
Key: sungrow.ql.total_active_power (We matched keys to the config names from the solariot project.)(ql is query live)
Master Item: <Batch Request>
Type: Numeric (Float)
Units: W (Watts)
Rest to your own preference.
Swap to the pre-processing tab; we need to extract the individual value from the json dump and make sure its a float value not text.
Add preprocessing step 1:
Type: JSONPath, Parameters: $.total_active_power
Step 2:
Type: Regular Expression, Parameters: “([0-9].+)” and “\1”, Custom On Fail: Tick
Step 2 Custom on Failure: Set Value to 0
Test if possible. You’ll need to paste an example json dump into the “value” field of the test screen if you’re using templates. It should return a float type value assuming the suns up and your inverter is producing.
Repeat for all other items that you want to track. Dependent items are run everything the item they depend on processes a value. Cloning an existing item, changing the name, key and preprocessing key seems to be the quickest way.
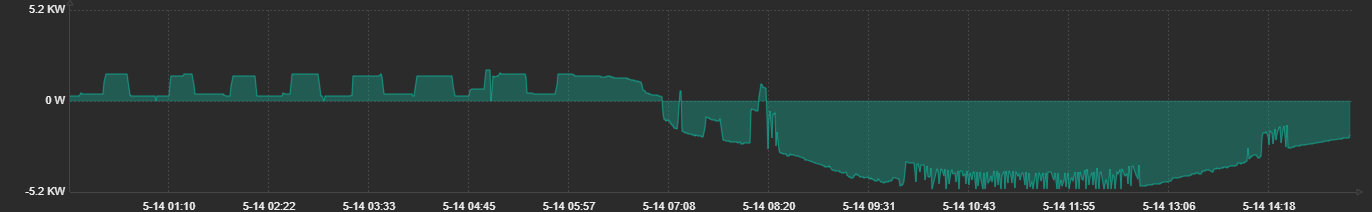
We created items so that individually imports and exports power (Grid Import and Grid Export) are both tracked as positive values. But by using the addition python code added in the above solariot.py script their is also a common Grid Import/Export item that tracks both, Power being drawn into the house being import as a positive value, excess solar generation being exported shown as a negative value.
This enables a very clear Import/Export Graph to be drawn. Take the example bellow.